Improving the representation of major Indian crops in the Community Land Model version 5.0 (CLM5) using site-scale crop data
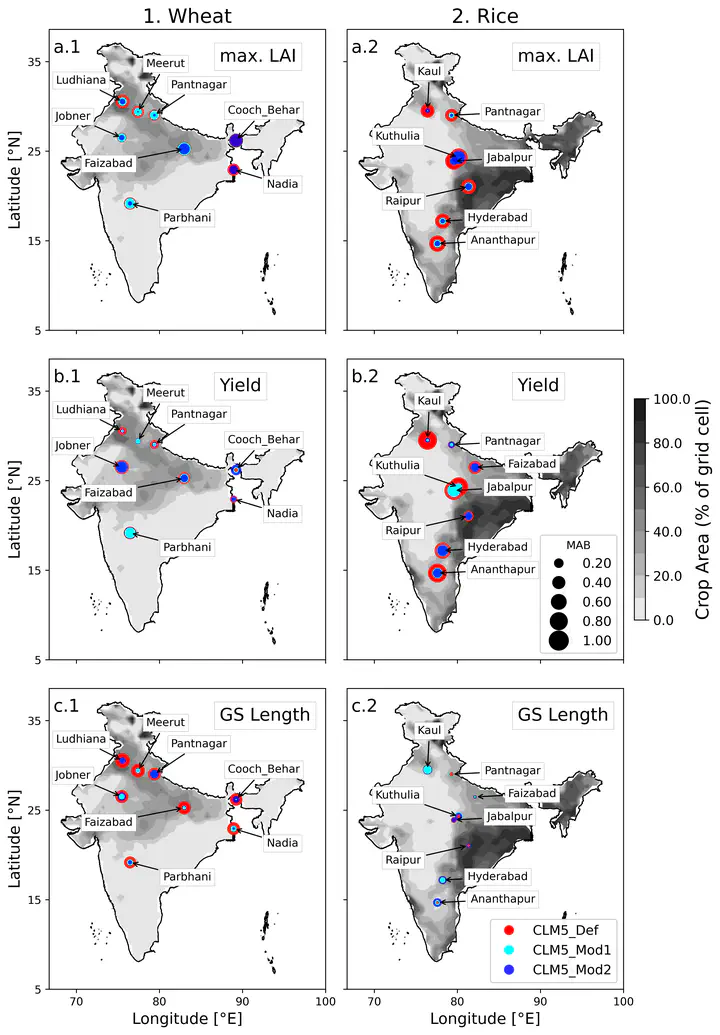 Site-scale CLM performance against observations for (1) wheat and (2) rice. Crop variables compared are (a) maximum LAI during the growing season, (b) yield, and (c) growing season length. The three markers at each site location show the MAB of CLM5_Def (red), CLM5_Mod1 (cyan), and CLM5_Mod2 (blue). The MAB ranges from 0 to 1. The contour on the map is the crop area per 0.5° grid cell.
Type
Publication
Geoscientific Model Development
Kangari Narender Reddy
Reasearch Scientist
My research interests include land surface modeling, surface fluxes (water, energy, and carbon fluxes), and renewable meteorology. I worked with the Integrated Science Assessment Model (ISAM) and the Community Land Surface Model version 5.0 (CLM5.0). I am currently working on implementing the “p-model” in the JULES LSM.